You’ve done the hard work of collecting and cleaning your data. You’re excited. You fire up your notebook, plot a few histograms to get a feel for the distributions, and… your heart sinks a little. The plots aren't the beautiful, symmetric bell curves you see in textbooks. They’re lopsided, with long tails stretching out to one side, and a few data points living in a completely different zip code. Welcome to the world of skewed data and outliers.
This is a classic machine learning crossroads. You know that most algorithms are pretty sensitive. They like their data neat, tidy, and on a level playing field. Feeding them raw, unscaled data is like asking a team of specialists who all speak different languages to collaborate on a project—it’s going to be chaotic, and the loudest (i.e., the feature with the largest scale) will dominate the conversation, leading to poor results.
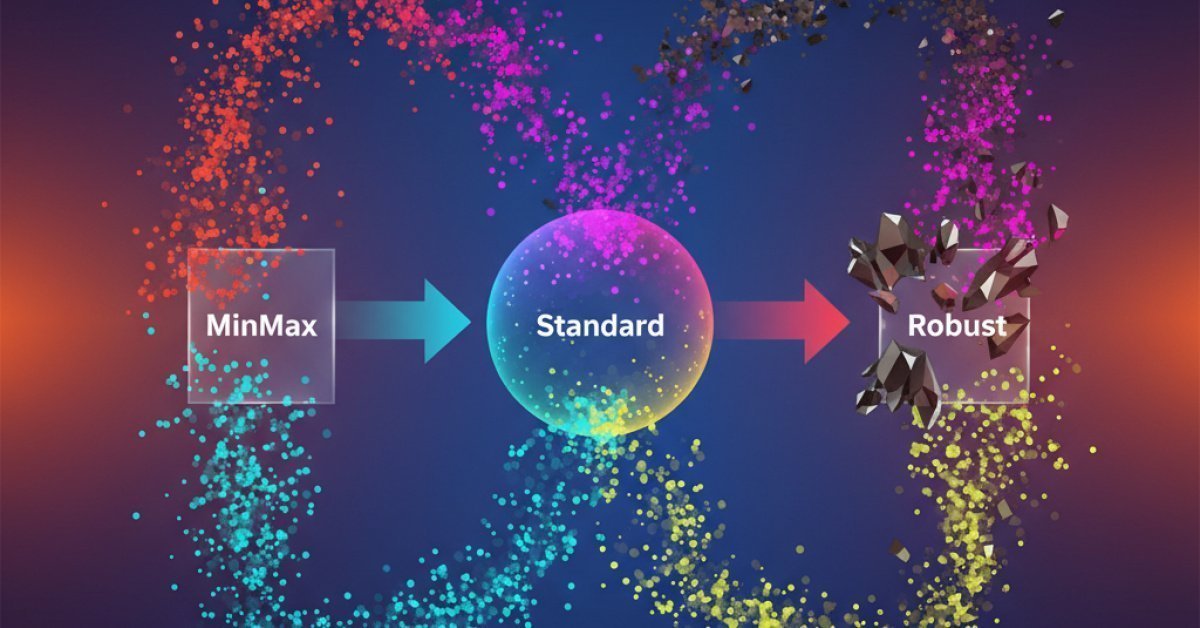
The solution is scaling. But which scaler do you pick from your scikit-learn toolkit? You've got StandardScaler, MinMaxScaler, and RobustScaler all vying for your attention. Choosing the wrong one for your skewed data can be just as bad as not scaling at all. So, let's settle the debate and figure out which one truly wins when the data gets weird.
Why You Can't Just 'Wing It' with Raw Data
Before we pit the scalers against each other, let's quickly cement why this step is absolutely non-negotiable. Imagine you're building a model to predict house prices, and you have two features: the number of bedrooms (ranging from 1 to 5) and the square footage (ranging from 800 to 5,000).
To a distance-based algorithm like K-Nearest Neighbors (KNN) or Support Vector Machines (SVM), that massive difference in scale is a huge problem. The algorithm will naturally assume that the square footage is vastly more important than the number of bedrooms, simply because the numbers are bigger. It will calculate the "distance" between data points incorrectly, biasing the entire model.
Scaling solves this by putting all your features on the same scale, ensuring no single feature unfairly dominates the learning process. It’s crucial for:
- Distance-based algorithms: KNN, SVM, K-Means Clustering.
- Gradient-based algorithms: Linear Regression, Logistic Regression, and a huge one—Neural Networks.
- Dimensionality Reduction: Techniques like Principal Component Analysis (PCA) are highly sensitive to data variance.
Even tree-based models like Random Forest or XGBoost, which are famously robust to feature scaling, can sometimes benefit from it, especially when regularization is involved. So, let’s just agree: scaling is a must-do. The real question is how.
Meet the Scalers: A Head-to-Head Comparison
Now for the main event. Let's break down our three contenders, understand how they work under the hood, and identify their critical strengths and weaknesses, especially when faced with messy, real-world data.
The Old Faithful: StandardScaler
StandardScaler is often the first scaler people learn. It's straightforward and based on a classic statistical concept: the Z-score.
How it works: For each feature, it calculates the mean and the standard deviation. Then, it transforms each data point by subtracting the mean and dividing by the standard deviation. The formula is (x - mean) / std_dev.
The result? Your feature will now have a mean of 0 and a standard deviation of 1. It centers your data directly around zero.
The fatal flaw: The mean and standard deviation are extremely sensitive to outliers. A single data point that's way off in the distance will drag the mean towards it and inflate the standard deviation. When this happens, StandardScaler takes the bulk of your normal data and squishes it into a very narrow range close to zero. The outlier gets scaled, but at the expense of ruining the variance of everything else. For skewed data, this is a disaster.
The Range Squeezer: MinMaxScaler
MinMaxScaler is another popular choice, loved for its simplicity. It transforms your data to fit within a specific, predetermined range—usually 0 to 1.
How it works: It finds the minimum and maximum values in your feature column. Then, it rescales every data point using the formula (x - min) / (max - min).
The result? The smallest value in your original data becomes 0, the largest becomes 1, and everything else falls somewhere in between.
The fatal flaw: Just like StandardScaler, MinMaxScaler is completely at the mercy of outliers. If you have a feature for "customer age" that's mostly between 20-60, but a single data entry error says "200," that outlier becomes your new maximum. Consequently, all the legitimate ages between 20 and 60 get squeezed into a tiny portion of the 0-to-1 range, losing their distinctiveness. It’s like trying to look at a detailed map that’s been shrunk down to the size of a postage stamp.
The Outlier Warrior: RobustScaler
This brings us to our third contender, and as its name suggests, it's built for toughness. RobustScaler is designed specifically to handle data with outliers.
How it works: Instead of using the mean and standard deviation, RobustScaler uses statistics that are, well, robust to outliers: the median and the Interquartile Range (IQR). The IQR is the range between the 1st quartile (25th percentile) and the 3rd quartile (75th percentile). The formula is (x - median) / IQR.
The secret weapon: The median and IQR focus on where the bulk of your data lies. A few extreme outliers on either end have very little effect on them. By using these more resilient metrics, RobustScaler effectively ignores the outliers when calculating the scaling parameters. It centers the data on the median and scales it based on the spread of the core data points.
The outliers are still there, but they don't dictate the scale of everything else. This is exactly what you want when dealing with skewed distributions.
The Visual Test: Which Scaler Actually Works on Skewed Data?
Talk is cheap. Let's visualize what happens when we throw a heavily skewed dataset—like household income, where most people earn a moderate amount but a few earn an astronomical figure—at each of our scalers.
Imagine a histogram of this raw income data. It would be heavily skewed to the right, with a large peak on the left and a long, thin tail stretching out towards the high-income earners.
-
After StandardScaler: You apply StandardScaler and plot the new histogram. What do you see? The shape is identical. It's still heavily skewed. The mean was pulled to the right by the high-income outliers, so the bulk of the "normal" income data is now clustered in a tight bunch on the negative side of the new distribution. You haven't really fixed the problem; you've just shifted it.
-
After MinMaxScaler: Now you try MinMaxScaler. The result is even worse for interpretation. The one billionaire in your dataset becomes the '1', and everyone else, from the minimum wage earner to the upper-middle-class professional, gets squashed into a tiny range like 0.0 to 0.05. You've effectively erased all the meaningful variance in 99.9% of your data.
-
After RobustScaler: Finally, you use RobustScaler. The difference is night and day. The scaler uses the median income (a much more representative measure of central tendency) and the IQR. The resulting distribution is centered, and the data points for the majority of people are spread out nicely. The outliers—the billionaires—are still present as extreme values, but they haven't corrupted the scaling of the main distribution. Your model can now learn from the meaningful patterns in the bulk of the data.
For skewed data, RobustScaler is the undisputed champion among these three.
Beyond the Big Three: When You Need More Firepower
Sometimes, your data is so wildly non-normal that even RobustScaler isn't quite enough. The distribution might be bimodal or follow a power law. In these cases, you might need to move beyond simple scaling and into the world of transformations.
A transformation actually changes the shape of your distribution, while scaling just changes the range.
-
PowerTransformer: This tool (which includes Box-Cox and Yeo-Johnson transformations) is a powerhouse. It applies a mathematical function to your data to make it more Gaussian-like (i.e., more like a normal bell curve). This can be an incredible preprocessing step before you apply a scaler like StandardScaler.
-
QuantileTransformer: This is another powerful option that transforms the feature distribution to follow a uniform or a normal distribution. It works by mapping the data to percentiles. It can be very effective at spreading out the most frequent values and reducing the impact of outliers.
Think of these as the heavy artillery. You bring them in when the initial skirmish with RobustScaler reveals a more deeply entrenched problem with your data's underlying distribution.
So, Which Scaler Should You Choose?
We've been through the theory, the mechanics, and the practical results. The choice of scaler isn't just a trivial step; it's a critical decision that directly impacts your model's ability to learn.
Here's your cheat sheet for making the right call:
- If your data is clean, mostly symmetrical, and has no significant outliers,
StandardScaleris a solid, reliable default choice. - If you have a specific reason to bound your values within a [0, 1] range (like for image data or certain neural network layers) AND you're confident your data is free of major outliers,
MinMaxScalercan be useful. - If your data is skewed in either direction or you know/suspect it contains outliers,
RobustScalershould be your go-to. It is, by design, the best tool for this common, messy scenario. - If your data's distribution is extremely non-normal, consider applying a
PowerTransformerorQuantileTransformerfirst to reshape the distribution, and then follow it up with a scaler.
Ultimately, the best advice is to never work blind. Before you write a single line of scaler.fit_transform(), plot your data. Look at the histograms and box plots. Understand the story your features are telling you. Once you see the skew and identify the outliers, the choice of which tool to use becomes crystal clear. Your model will thank you for it.